In The Ithacan’s Fall 2024 Diversity Report, we examine the demographics of our editorial board and questions about diversity, equity, inclusion and belonging within our workplace.
Last year, we expanded our diversity report to include more questions about our DEIB efforts and board members’ comfort level in our workplace related to their identities. Community outreach manager Kai Lincke used the same questions in the survey for this year to compare data and identify changes and improvements from last year.
This year’s survey included 12 questions, with some multiple-choice and some open-ended questions, as necessary, to fully show our board members’ identities. As we have done in past reports, we kept all answers anonymous and compared answers to Ithaca College student population data when available and applicable.
We sent the survey to the 26 members of the Fall 2024 editorial board, and 21 members filled out the survey. This is a similar completion rate to Fall 2023, when 21 out of 27 board members completed the form. While we recognize that this does not fully represent our editorial board, we hope that this data provides a starting point for us to understand how we represent the student body and how we can improve our efforts to make our workspace inclusive, welcoming and affirming.
As a student-led media outlet, The Ithacan strives to represent the voice of students across campus and value students’ lived experiences and identities. We are committed to elevating underrepresented voices and understand the importance of ensuring diverse representation in our editorial board and our coverage. We also strive to be fully transparent about our team’s makeup and our organizational culture and will work to address gaps in representation. We will use the results from this report to track our progress as an organization and guide our efforts to develop goals and strategies to improve inclusion and representation.
Our findings: Demographics
Class Year
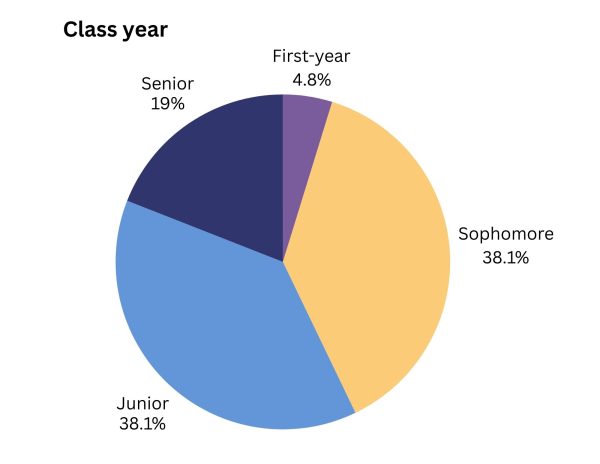
The editorial board is primarily composed of upperclassmen, with 19% of survey respondents indicating that they are seniors and 38.1% of respondents indicating that they are juniors. This is a slight change from 2023, when 33.3% of respondents were juniors and 23.8% of respondents were seniors. The share of first-year students and sophomores on the board is the exact same as 2023, at 4.8% and 38.1% of respondents, respectively.
First-generation status
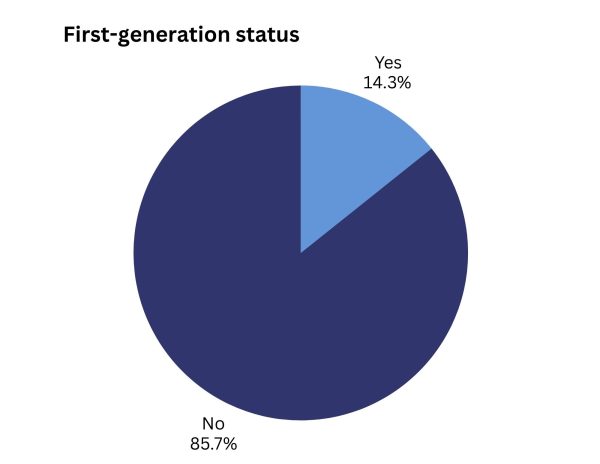
The college defines first-generation as “students (and their siblings) who are the first in their family to attend and graduate from a four-year residential college in the U.S.” According to the college’s website, approximately 15% of students in each incoming class identify as first-generation students.
Our survey results show that the share of first-generation survey respondents increased to 14.3% in 2024, from 9.5% in 2023 and 4.5% in 2022.
Racial and ethnic background
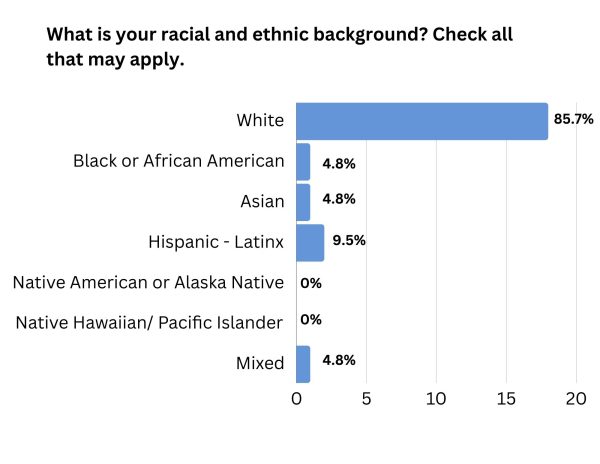
Following the U.S. Census Bureau’s standards for collecting racial and ethnic background data, we included six multiple-choice options for students’ race in this survey. We also added an option for mixed-race identities and allowed respondents to select as many options as apply to their racial identity.
The Ithacan editorial board continues to be predominantly white, with 18 out of 21, or 85.7%, of respondents identifying as white. One respondent identified as Black or African American, one respondent identified as Asian, two respondents identified as Hispanic-Latinx and one respondent identified as mixed. There were still no survey respondents who identified as Native American or Alaska Native, or Native Hawaiian/Pacific Islander.
The share of survey respondents who identified as Black, Indigenous or People of Color was 19.1%. This is a decrease from 23.8% in 2023 and 28% in 2022.
Population data from the Office of Analytics and Institutional Research show that 24.1% of the college’s students identify as BIPOC, 3.3% identify as international students and 70.5% identify as white in Fall 2024.
The college’s demographic data for race and ethnicity is different because it records the number of international students. We did not include a question about international student status in our survey.
Gender
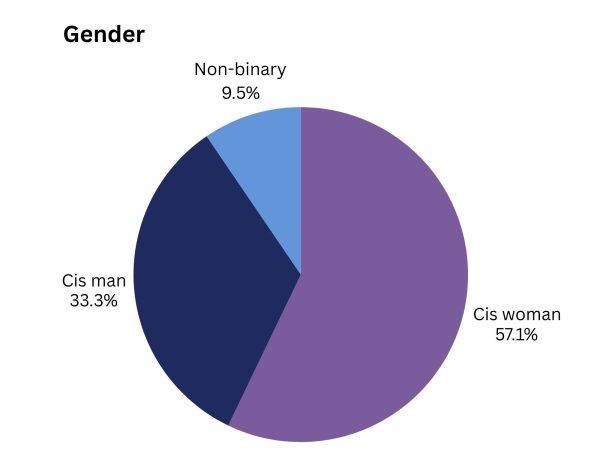
The Ithacan board continues to be predominantly composed of cisgender women. Cisgender women made up 57.1% of respondents in 2024, compared to 76.2% of respondents in 2023 and 65.2% of respondents in 2022. The share of cisgender men on the board increased from 14.3% of respondents in 2023 to 33.3% in 2024. The share of non-binary board members remains the same as 2023, at 9.5% of respondents.
None of the respondents identified as transgender or selected the “prefer not to say” option.
According to the Office of AIR’s 2024–25 Facts in Brief, 53.9% of students identify as women and 42.2% of students identify as men in Fall 2024.
Additionally, 184 students shared that they identified as non-binary in Fall 2024. This represents about 4% of students at the college. However, gender reporting practices only allowed the college to record incoming students’ sex assigned at birth until Fall 2022, which means that this data may not fully represent all students who identify outside of the gender binary.
Sexuality
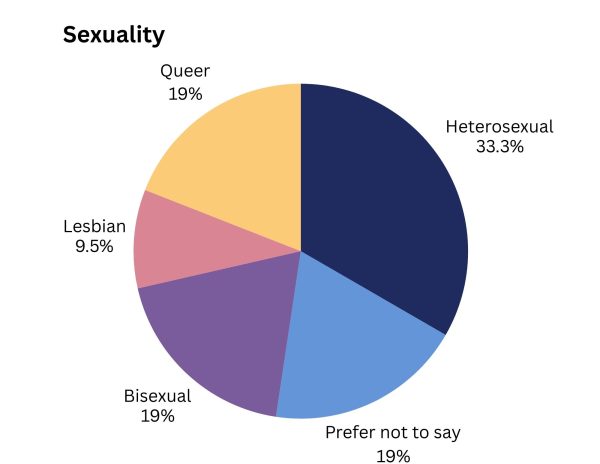
For this survey question, each board member wrote their response in a text box. This means that the categories for sexuality data reflect how each respondent defines their sexuality.
Our findings show that 33.3% of respondents identify as heterosexual, a decrease from 52.4% of respondents in 2023. This year, 19% of respondents said they prefer not to share their sexuality, an increase from 4.8% of respondents in 2023.
We also found that 19% of respondents identify as queer, 19% identify as bisexual and 9.5% identify as lesbian. In 2023, 4.8% of respondents identified as queer, 19% identified as bisexual, 14.3% identified as lesbian and 4.3% identified as pansexual.
There is no readily available data about sexuality to compare with the college’s student body. However, the college received the top spot on Best Colleges’ list of LGBTQ+ friendly colleges in 2024 and has been ranked on the Campus Pride Index’s “Best of the Best” list since 2012.
Ability
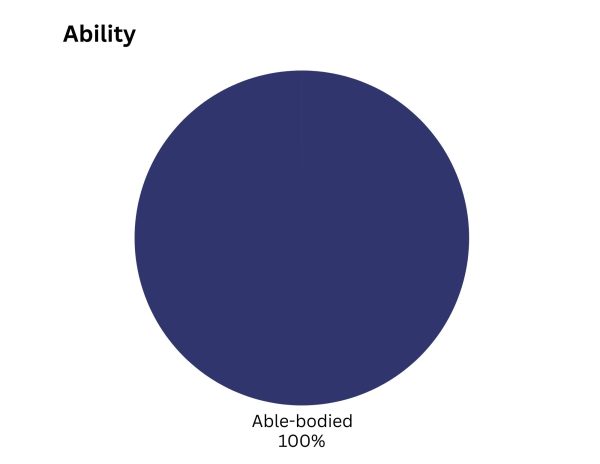
Our population of disabled board members has decreased from 4.8% of respondents in 2023 to 0% in 2024. The college does not share publicly available data about ability, so we cannot compare the larger student body with The Ithacan’s board.
Religion
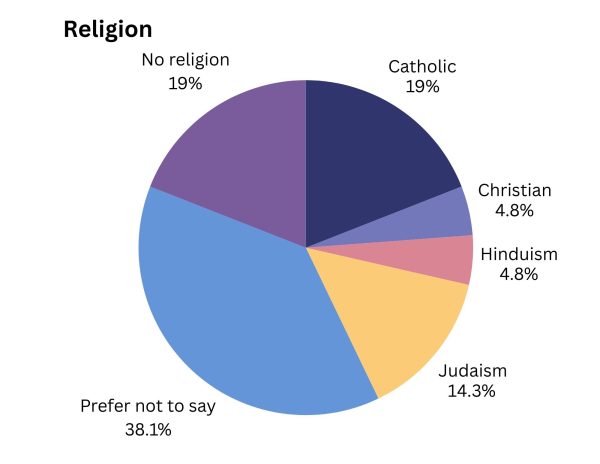
We found that 19% of respondents do not practice a religion, 19% practice Catholicism, 14.3% practice Judaism, 4.8% practice Hinduism and 4.8% practice Christianity. Additionally, 38.1% of respondents preferred not to share their religion.
The college does not share publicly accessible data about students’ religion and The Ithacan has not previously shared data about board members’ religion, so we cannot compare our results.
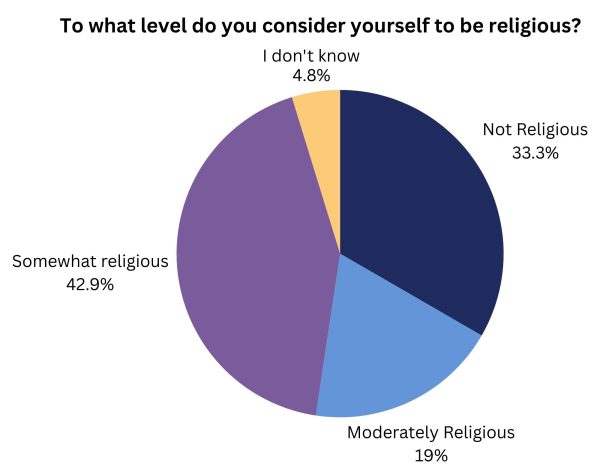
Our results show that 42.9% of respondents are somewhat religious, 33.3% are not religious and 19% are moderately religious. Also, 4.8% of respondents do not know how religious they are.
Our findings: Workplace culture
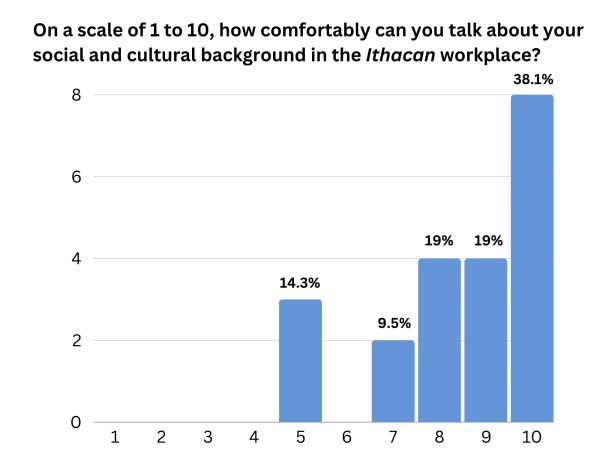
We asked respondents to evaluate, on a scale of one to 10, how comfortably they can discuss their social and cultural background in The Ithacan workplace. Our results show that 14.3% of respondents measure their comfort level at a five, 9.5% at a seven, 19% at an eight, 19% at a nine and 38.1% at a 10.
In 2023, 9.5% of board members responded five, 4.8% responded six, 23.8% responded seven, 28.6% responded eight, 14.3% responded nine and 19% responded 10. The largest change from 2023 to 2024 was in the number of students who rate their comfort level at a 10, with 19% of respondents responding 10 in 2023 and 38.1% responding 10 in 2024.
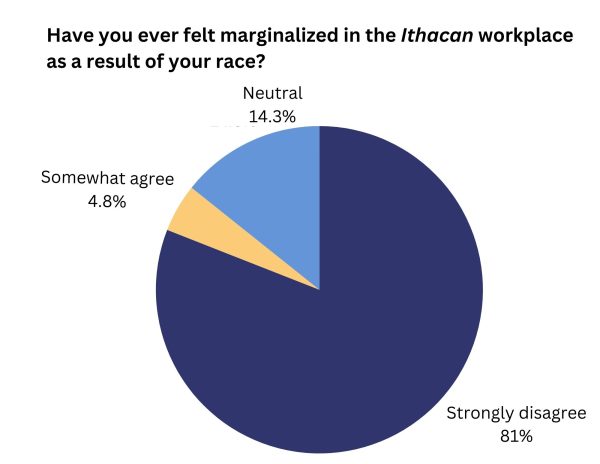
We asked respondents to share if they have ever felt marginalized in The Ithacan workplace. Our results show that 81% of respondents strongly disagreed, 14.3% were neutral and 4.8% somewhat agreed.
The share of students who strongly disagreed in 2023 was similar, at 85.7%. In 2023, 4.8% of respondents said they somewhat disagree, 4.8% said they were neutral and 4.8% said they somewhat agree.
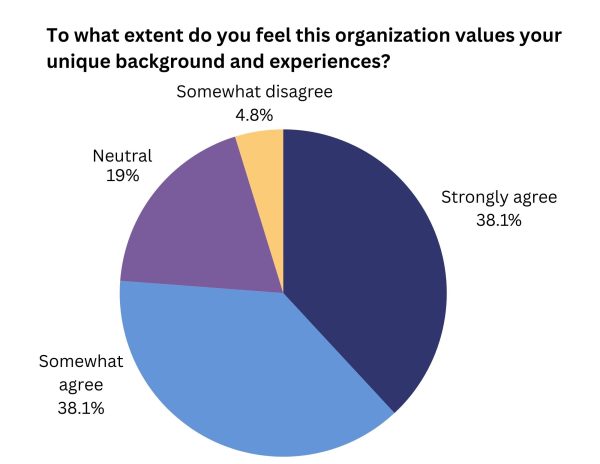
When we asked respondents to share the extent that they feel our organization values their unique background and experiences, 38.1% said they somewhat agree, 38.1% said they strongly agree, 19% said they felt neutral and 4.8% said they somewhat disagree.
This marks an increase in the share of respondents who strongly agreed from 2023, when 23.8% said they strongly agreed. In 2023, 52.4% of respondents said they somewhat agreed, 19% said they felt neutral and 4.8% said they somewhat disagreed.
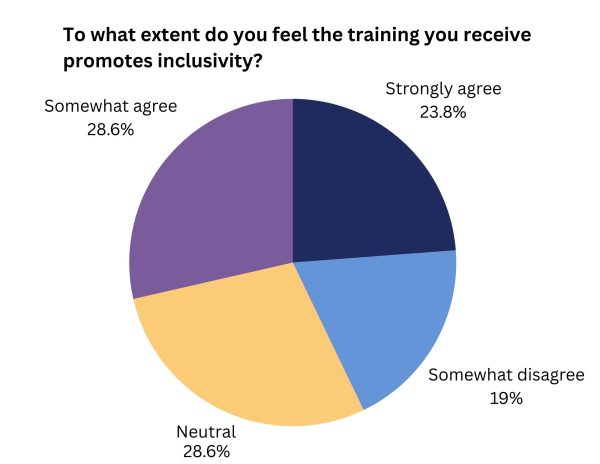
Finally, we asked respondents about whether they feel the training they receive promotes inclusivity. We found that 28.6% of respondents somewhat agreed, 28.6% were neutral, 23.8% strongly agreed and 19% somewhat disagreed.
In 2023, 42.9% of respondents somewhat agreed, 23.8% felt neutral, 19% strongly agreed and 14.3% somewhat disagreed.
Our call to action:
The Ithacan is committed to supporting diversity and inclusivity and elevating marginalized voices. We recognize that we must make changes to improve representation on the board and ensure that board members feel their identities are valued in our workplace. We will continue to work on building resources to help our Editorial Board and staff make The Ithacan a workplace and an organization that supports and advances diversity, equity, inclusion and belonging.


