
For this year’s The Ithacan diversity report, we are delving into demographics as well as questions regarding DEI culture in The Ithacan. The new diversity report was formulated by the current community outreach manager, Zhannz Gomez. We asked for demographic and opinion-based questions in an effort to compare last year’s data and monitor changes and improvements. The new survey consisted of 12 questions and some were answered by multiple choice, while others were open-ended. Similar to our previous reports, all answers are anonymous, and the answers were charted and compared to available Ithaca College student population data when applicable. The survey was sent out to all 27 of The Ithacan’s editorial board members and 6 opted out.
This report will help track our progress as an organization and be a stepping point towards creating strategies and setting achievable but ambitious goals. Being a student-run publication means we are committed to elevating underrepresented voices and understand the importance of ensuring diverse representation in our editorial board and our coverage. This begins by being clear about our current state and future goals.
The insights gained from the previous diversity report have allowed us to share this year’s data, reflect on our progress and update the necessary steps forward. We strive to be fully transparent about our makeup and organizational culture and continue to address gaps in representation. We are intent on working towards an inclusive environment where we celebrate and promote inclusivity within our own walls. This year, the report has adapted to include a wider range of questions to gauge the overall sense of comfortability around diversity and DEIB topics.
Our Findings are:
Racial and ethnic background
In accordance with the U.S. Census Bureau’s standard of collecting racial and ethnic background data, this survey question had six multiple-choice options. The Ithacan editorial board continues to be predominantly white, with the percentage of white editorial board members increasing 9% from last year. This year’s diversity report included an option for mixed-race identities, no board members identified as mixed-race.
The findings show that there are still no members that are Alaskan Native or Pacific Islander. Black, Indigenous and people of color (BIPOC) on The Ithacan’s board represented 23.8% of the newsroom; a 4.2% decrease in BIPOC representation compared to 2022. This is 2.1% higher than the BIPOC population at Ithaca College as of Fall 2023, compared to last year’s 7.3%. Population data for the campus is located under the Office of Analytics and Institutional Research (AIR) on the college’s website.
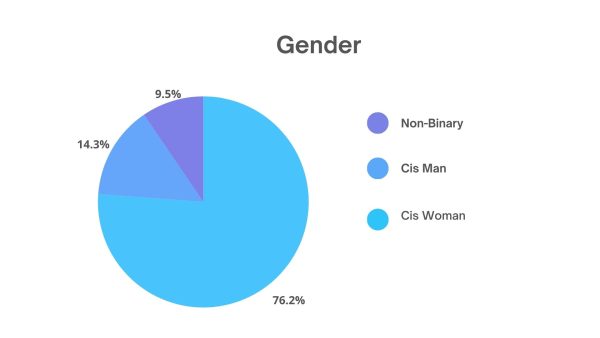
Gender
The Ithacan board continues to be predominantly composed of cisgender women with cisgender women making up 76.2 % an 11% increase from 2022. Cisgender men make up 14.3% of our board, a 7.4% decrease compared to last year. The student body of Ithaca College is reported as being 57% women and 43% men. Nonbinary representation on the editorial board has grown to 9.5%, a 0.8% increase from last year. No board members identified as transgender, a 4.3% decrease from last year. The AIR does not report the number of nonbinary or transgender students at the college.
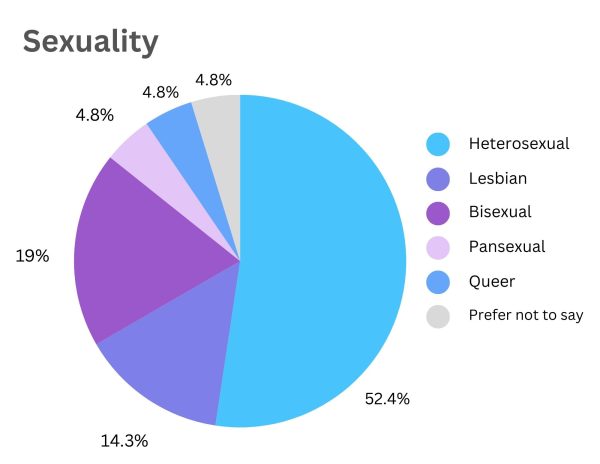
Sexuality
This survey question was not multiple choice, and each board member wrote their answer in a text box. This means the categories for sexuality data are specific to how the board member completing the form identifies. Bisexual identities were reported at 19.1% and heterosexual sexual identities reported at 52.3%. While 14.3% identified as lesbian, 4.8% queer and 4.8% as pansexual. For this and the following categories, there is no readily available data to compare with the college’s student body. However, the college continues to be ranked as the “Best of the Best” on the Campus Pride index since 2012.
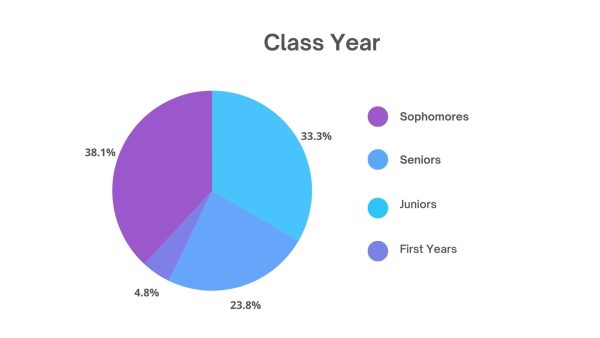
Class Year
The editorial board is mostly composed of upperclassmen, with the number of juniors reported being 33.3% and seniors being at 23.8%. The largest group is sophomores who make up 38.1% while the smallest group is first-years, who make up 4.8% compared to 0 first years in 2022.
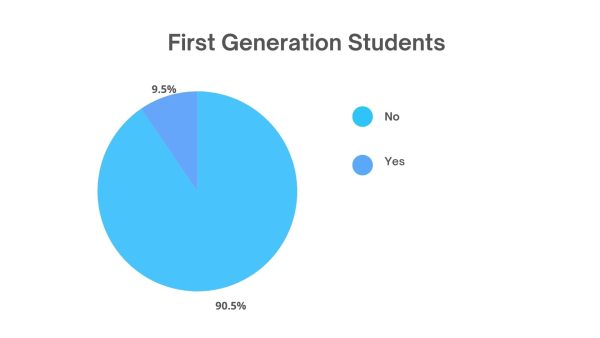
First Generation
According to the college’s website, 17.4% of undergraduate students are first-generation students. Ithaca College defines First Generation as “Students (and their siblings) who are the first in their family to attend and graduate from a four-year residential college in the U.S…” Our representation of first-generation students increased slightly from 4.5% to 9.5%.
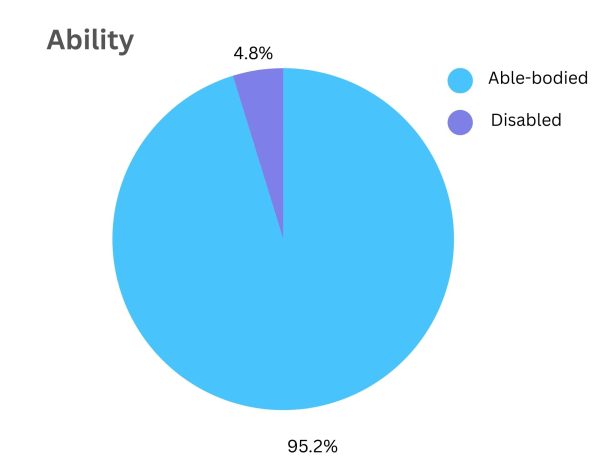
Ability
Ithaca College still lacks publicly available data to compare the larger student body with The Ithacan’s board. However, our population of disabled members in Fall 2023 was 4.8%, a decrease from 8.7% in Fall 2022.
When asked the question “Do you feel the training you receive promotes inclusivity?” the board members’ responses were:
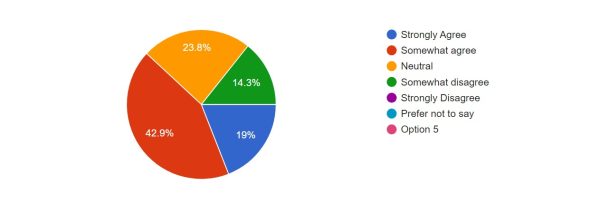
19% of members strongly agree, 42.9% members somewhat agree, 23.8% are neutral and 14.3% somewhat disagree.
When asked the question “On a scale of 1 to 10, how comfortably can you talk about your social and cultural background in the workplace?” the board members’ responses were:
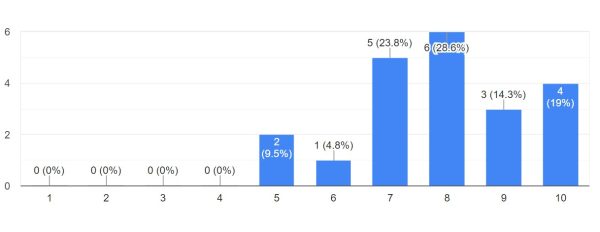
9.5% responded five, 4.8% responded six, 23.8% responded seven, 28.6% responded eight, 14.3% responded nine and 19% responded 10.
When asked the question “Have you ever felt marginalized in the workplace as a result of your race?” The board members responded:
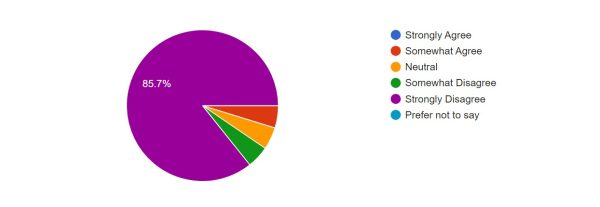
85.7% strongly disagree, 4.8% somewhat disagree, 4.8% are neutral and 4.8% somewhat agree.
When asked the question “Do you feel that this organization values your unique background and experiences?” the board members responded:
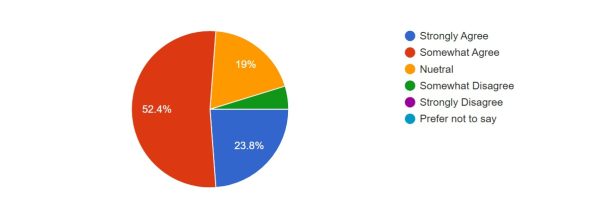
52.4% somewhat agree, 23.8% strongly agree, 19% are neutral and 4.8% somewhat disagree.
Our call to action:
Our commitment lies in harboring diversity and inclusivity while elevating marginalized perspectives. While changes certainly have to be made to improve organizational culture, we are slowly making progress towards building resources to ensure our Editorial Board and staff are equipped with the tools needed to make The Ithacan a workplace and organization that fosters diversity.
Editor’s Note: The pie charts for sexuality and ability previously did not match the data received from the survey. The charts have been updated, as of Dec. 22, 2024, to accurately reflect the survey results.


Carlos • Dec 7, 2023 at 8:57 am
As much as I appreciate these IC culturally diverse data, I would like to see student family income figures. The latter data also helps us better understand how much class and economic diversity, equity, and inclusion exist at the college. The goal should be to apply the principles of diversity, equity, and inclusion fully. Thanks 🙏